Self Hosted Telemetry Solution Based on Open Telemetry
Why I want to self-host my telemetry stack
In 2024, there’s literally no affordable, fully customizable and privacy focused telemetry solution on this market. This article is introducing another way of telemetry / data analysis, which is to build a solution leveraging Open Telemetry, with nearly zero cost for development.
This stack may look pretty simple and fragile. But it has a lot of potential to be more powerful than paid SaaS solutions. If you found this solution useful, please consider to sponsor me on GitHub, https://github.com/sponsors/imWildCat. Over the years, I found it is much more difficult to monetize advanced software skills. Your sponsorship means a lot to me to create more useful contents. Thank you!
In my app, Twilar, which is a offline-first, read-it-later app, we value privacy. We plan to sunset 3rd-party telemetry solutions like Google Firebase. In addition, we also want to measure high-frequency performance data of the app so that we’ll be able to build a world-class experience. By the way, if you’d like to support me but not on GitHub, you could consider to purchase this app : ) Thanks again!
Why Open Telemetry
Open Telemetry is already a widely used telemetry standard with production ready SDKs and backend (collectors, exporters, .etc). Many big tech companies are using this solution without explicitly mentioning it.
It basically offers end-to-end solutions to meet nearly all your telemetry “collection” and “storage” needs. However, for visualization of the data, you’ll need another project, like Apache Superset, MetaBase.
By the way, for data storage, you can use any SQL/non-SQL database (https://opentelemetry.io/docs/specs/semconv/attributes-registry/db/) you like or other solutions.
In this article, we’ll use ClickHouse.
Get Started (Server-side)
├── collector
│   ├── Dockerfile
│   └── otel-collector-config.yaml
├── docker-compose.yml
└── superset
    ├── Dockerfile
    ├── superset-init.sh
    └── superset_config.py
Docker Compose
“Talk is cheap, show me your code”. In this article, we’re using Docker Compose to demonstrate what the app look like.
version: "3"
services:
  otel-collector: # the service endpoint to receive http/grpc data
    image: otel/opentelemetry-collector-contrib:0.92.0
    restart: unless-stopped
    volumes:
      - ./collector/otel-collector-config.yaml:/etc/otel-collector-config.yaml
    command: ["--config=/etc/otel-collector-config.yaml", "${OTELCOL_ARGS}"]
    environment:
      - CLICKHOUSE_PASSWORD=${CLICKHOUSE_PASSWORD}
    depends_on:
      - clickhouse
    # ports:
    #   - "4317:4317" # gRPC
    #   - "4318:4318" # HTTP

  clickhouse:
    image: clickhouse/clickhouse-server
    # ports:
    #   - "8123:8123" # HTTP interface
    environment:
      - CLICKHOUSE_DB=app_otel
      - CLICKHOUSE_USER=app_otel
      - CLICKHOUSE_DEFAULT_ACCESS_MANAGEMENT=1
      - CLICKHOUSE_PASSWORD=${CLICKHOUSE_PASSWORD}
    volumes:
      # raw data
      - ./data/clickhouse/data:/var/lib/clickhouse
      # logs
      - ./data/clickhouse/log:/var/log/clickhouse-server
    expose:
      - "8123"
      - "9000"
    ulimits:
      nofile:
        soft: 262144
        hard: 262144
    logging: &default_logging
      driver: "json-file"
      options:
        max-size: "10m"
        max-file: "3"

  superset:
    build: # we need clickhouse driver so we must run pip install for this image
      context: ./superset
      dockerfile: Dockerfile
    depends_on:
      - clickhouse
    # ports:
    #   - "8088:8088" # Superset web app
    environment:
      - SUPERSET_HOME=/data
      - SUPERSET_LOAD_EXAMPLES=true
      - ADMIN_USERNAME=${SUPERSET_ADMIN_USERNAME}
      - ADMIN_EMAIL=${SUPERSET_ADMIN_EMAIL}
      - ADMIN_PASSWORD=${SUPERSET_ADMIN_PASSWORD}
      - SUPERSET_SECRET_KEY=${SUPERSET_SECRET_KEY}
    volumes:
      - ./data/superset_home:/data
    logging: *default_logging

  # TODO: avoid custom build if you don't need ClickHouse or other database drivers
  # superset:
  #   image: apache/superset:latest-dev
  #   depends_on:
  #     - clickhouse
  #   # ports:
  #   #   - "8088:8088" # Superset web app
  #   environment:
  #     - SUPERSET_LOAD_EXAMPLES=yes
  #     - SUPERSET_SECRET_KEY=${SUPERSET_SECRET_KEY}
  # volumes:
  #   - ./superset_home:/app/superset_home
  # logging: *default_logging

  redis:
    image: redis:alpine
    restart: always
    volumes:
      - ./data/redis:/data

  cloudflared-collector:
    image: cloudflare/cloudflared
    command: tunnel --no-autoupdate run --url http://otel-collector:4318 --no-tls-verify
    depends_on:
      - otel-collector
    environment:
      - TUNNEL_TOKEN=${COLLECTOR_TUNNEL_TOKEN}
      - NO_AUTOUPDATE=true
      - TUNNEL_PROXY_ADDRESS=otel-collector
      - TUNNEL_PROXY_PORT=4318
    logging: *default_logging

  cloudflared-superset:
    image: cloudflare/cloudflared
    command: tunnel --no-autoupdate run --url http://superset:8088 --no-tls-verify
    depends_on:
      - superset
    environment:
      - TUNNEL_TOKEN=${SUPERSET_TUNNEL_TOKEN}
      - NO_AUTOUPDATE=true
      - TUNNEL_PROXY_ADDRESS=superset
      - TUNNEL_PROXY_PORT=8088
    logging: *default_logging
where the .env file is like:
# CloudFlare tunnel token so you don't need to expose the port on the host machine and build another reverse proxy (i.e. nginx)
# But please feel free to build your own stack to expose the Superset service.
# For more information, please refer to <https://developers.cloudflare.com/cloudflare-one/connections/connect-networks/>
COLLECTOR_TUNNEL_TOKEN=
SUPERSET_TUNNEL_TOKEN=

CLICKHOUSE_PASSWORD=

SUPERSET_ADMIN_USERNAME=
SUPERSET_ADMIN_EMAIL=
SUPERSET_ADMIN_PASSWORD=

SUPERSET_SECRET_KEY=

OTELCOL_ARGS=
Collector Configuration
We need to tell the Open Telemetry Collector to:
- Export the data from http/gRPC to ClickHouse
- It should also know the credentials of ClickHouse connection
- Expose either
So, the otel-collector-config.yaml would be like:
# Full documentation: <https://opentelemetry.io/docs/collector/configuration/>
receivers:
  otlp:
    protocols:
      http: {}
      # grpc: {}

exporters:
  clickhouse:
    endpoint: tcp://clickhouse:9000?dial_timeout=10s&compress=lz4
    database: app_otel
    traces_table_name: app_otel
    username: app_otel
    password: ${env:CLICKHOUSE_PASSWORD}

processors:
  batch:
    timeout: 5s
    send_batch_size: 100000

service:
  pipelines:
    traces:
      receivers: [otlp]
      processors: [batch]
      exporters: [clickhouse]
    logs:
      receivers: [otlp]
      processors: [batch]
      exporters: [clickhouse]
    metrics:
      receivers: [otlp]
      processors: [batch]
      exporters: [clickhouse]
Please note that this is nearly all you needed. In this case, since we need a custom docker image for the ClickHouse driver, extra steps are here:
Custom Superset Image
FROM apache/superset:latest-dev

USER root

# https://superset.apache.org/docs/databases/installing-database-drivers/

RUN pip install clickhouse-connect

ENV ADMIN_USERNAME $ADMIN_USERNAME
ENV ADMIN_EMAIL $ADMIN_EMAIL
ENV ADMIN_PASSWORD $ADMIN_PASSWORD

COPY ./superset-init.sh /superset-init.sh

COPY superset_config.py /app/
ENV SUPERSET_CONFIG_PATH /app/superset_config.py

USER superset
ENTRYPOINT [ "/superset-init.sh" ]
Superset Configuration File
# whole superset setup inspired by: <https://medium.com/towards-data-engineering/quick-setup-configure-superset-with-docker-a5cca3992b28>
# config: https://superset.apache.org/docs/installation/configuring-superset/
import os


FEATURE_FLAGS = {
    "ENABLE_TEMPLATE_PROCESSING": True,
}

ENABLE_PROXY_FIX = True

# also: <https://github.com/chdb-io/chdb-superset/blob/main/include/superset_config.py>

CACHE_CONFIG = {
    "CACHE_TYPE": "RedisCache",
    "CACHE_DEFAULT_TIMEOUT": 300,
    "CACHE_KEY_PREFIX": "superset_",
    "CACHE_REDIS_HOST": "redis",
    "CACHE_REDIS_PORT": 6379,
    "CACHE_REDIS_DB": 1,
    "CACHE_REDIS_URL": "redis://redis:6379/1",
}

FILTER_STATE_CACHE_CONFIG = {
    'CACHE_TYPE': 'RedisCache',
    'CACHE_DEFAULT_TIMEOUT': 86400,
    'CACHE_KEY_PREFIX': 'superset_filter_cache',
    'CACHE_REDIS_URL': 'redis://redis:6379/1'
}
Superset Entry-point
#!/bin/bash

# init doc: https://superset.apache.org/docs/installation/installing-superset-from-scratch/

# Upgrading Superset metastore
superset db upgrade

# create Admin user, you can read these values from env or anywhere else possible
superset fab create-admin --username "$ADMIN_USERNAME" --firstname Superset --lastname Admin --email "$ADMIN_EMAIL" --password "$ADMIN_PASSWORD"

echo "Created Admin user: $ADMIN_USERNAME"

# setup roles and permissions
superset superset init

# Starting server
/bin/sh -c /usr/bin/run-server.sh
Get Started (Client-side)
After this Docker Compose app is deployed, the next step is to measure your code (either server or client), and export the analytics data. In this post, I just share a simple code for TypeScript in web browsers. There are many SDKs available and their code quality is super high: https://opentelemetry.io/docs/languages/
TypeScript Sample Code
import { WebTracerProvider } from "@opentelemetry/sdk-trace-web";
import { SimpleSpanProcessor } from "@opentelemetry/sdk-trace-base";
import { OTLPTraceExporter } from "@opentelemetry/exporter-trace-otlp-http";
import { registerInstrumentations } from "@opentelemetry/instrumentation";
// import { DocumentLoadInstrumentation } from '@opentelemetry/instrumentation-document-load'; // instrument document load time
import { logs } from "@opentelemetry/api-logs";
import {
  LoggerProvider,
  SimpleLogRecordProcessor,
  ConsoleLogRecordExporter,
  BatchLogRecordProcessor,
} from "@opentelemetry/sdk-logs";
import { OTLPLogExporter } from "@opentelemetry/exporter-logs-otlp-http";
import { Resource } from "@opentelemetry/resources";
import { SemanticResourceAttributes } from "@opentelemetry/semantic-conventions";
import { LogAttributeValue, SeverityNumber } from '@opentelemetry/api-logs';


const otelHost = import.meta.env.PROD
  ? "production.web.site"
  : "development.web.site";

const traceCollectorUrl = `https://${otelHost}/v1/traces`;
const logCollectorUrl = `https://${otelHost}/v1/logs`;

const resource = new Resource({
  [SemanticResourceAttributes.SERVICE_NAME]: "my-demo-app",
  [SemanticResourceAttributes.SERVICE_NAMESPACE]: "foo",
});

const webTracerProvider = new WebTracerProvider({
  resource,
});
const traceExporter = new OTLPTraceExporter({
  url: traceCollectorUrl,
});

webTracerProvider.addSpanProcessor(new SimpleSpanProcessor(traceExporter));

webTracerProvider.register();

// Automatically collect page load and XHR traces
registerInstrumentations({
  instrumentations: [
    // new DocumentLoadInstrumentation({}),
    // new XMLHttpRequestInstrumentation(),
  ],
});

// To start a logger, you first need to initialize the Logger provider.
const loggerProvider = new LoggerProvider({
  resource,
});
// Add a processor to export log record
const logExporter = new OTLPLogExporter({ url: logCollectorUrl, headers: {} });
// Note: headers must be set. Ref: <https://github.com/open-telemetry/opentelemetry-js/issues/3062#issuecomment-1189189494>
if (import.meta.env.DEV) {
  loggerProvider.addLogRecordProcessor(
    new SimpleLogRecordProcessor(new ConsoleLogRecordExporter())
  );
}

loggerProvider.addLogRecordProcessor(new BatchLogRecordProcessor(logExporter));

// You can also use global singleton
logs.setGlobalLoggerProvider(loggerProvider);
export const defaultOtelLogger = logs.getLogger("default");

export function logTelemetry(eventName: string, params?: Record<string, LogAttributeValue>) {
  defaultOtelLogger.emit({
    SeverityNumber.INFO,
    body: eventName,
    attributes: params,
  });
}
Analyze Data using Apache Superset
I believe the official documentation of Superset would be much better than this article: https://superset.apache.org/docs/intro But there are two points we’d like to mention:
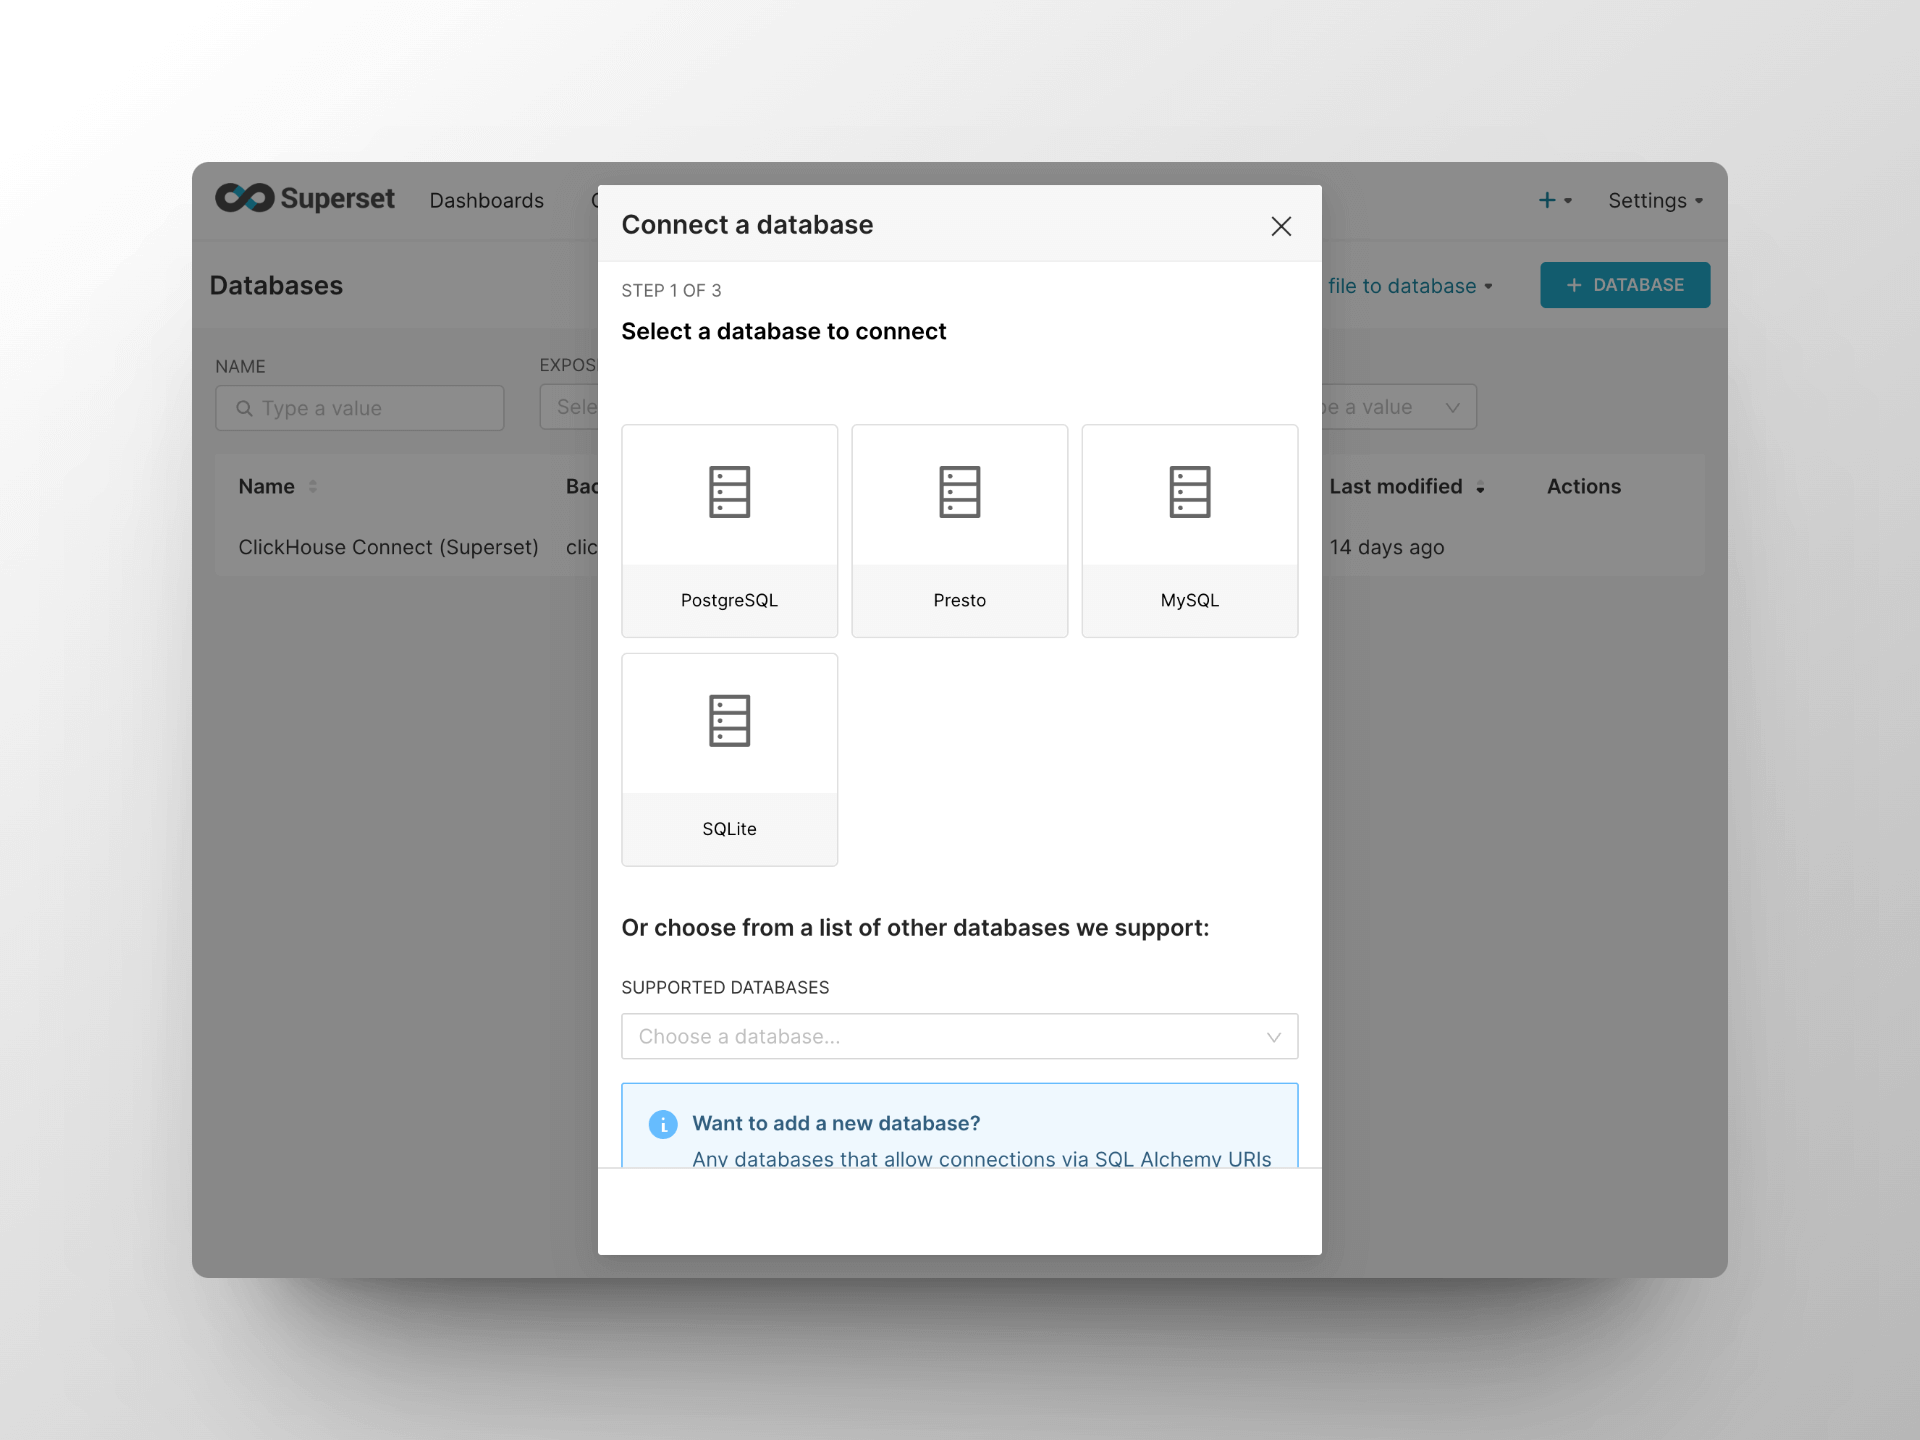
First, we have to connect the ClickHouse database via the web UI, at Settings > Database Connections > + Database.
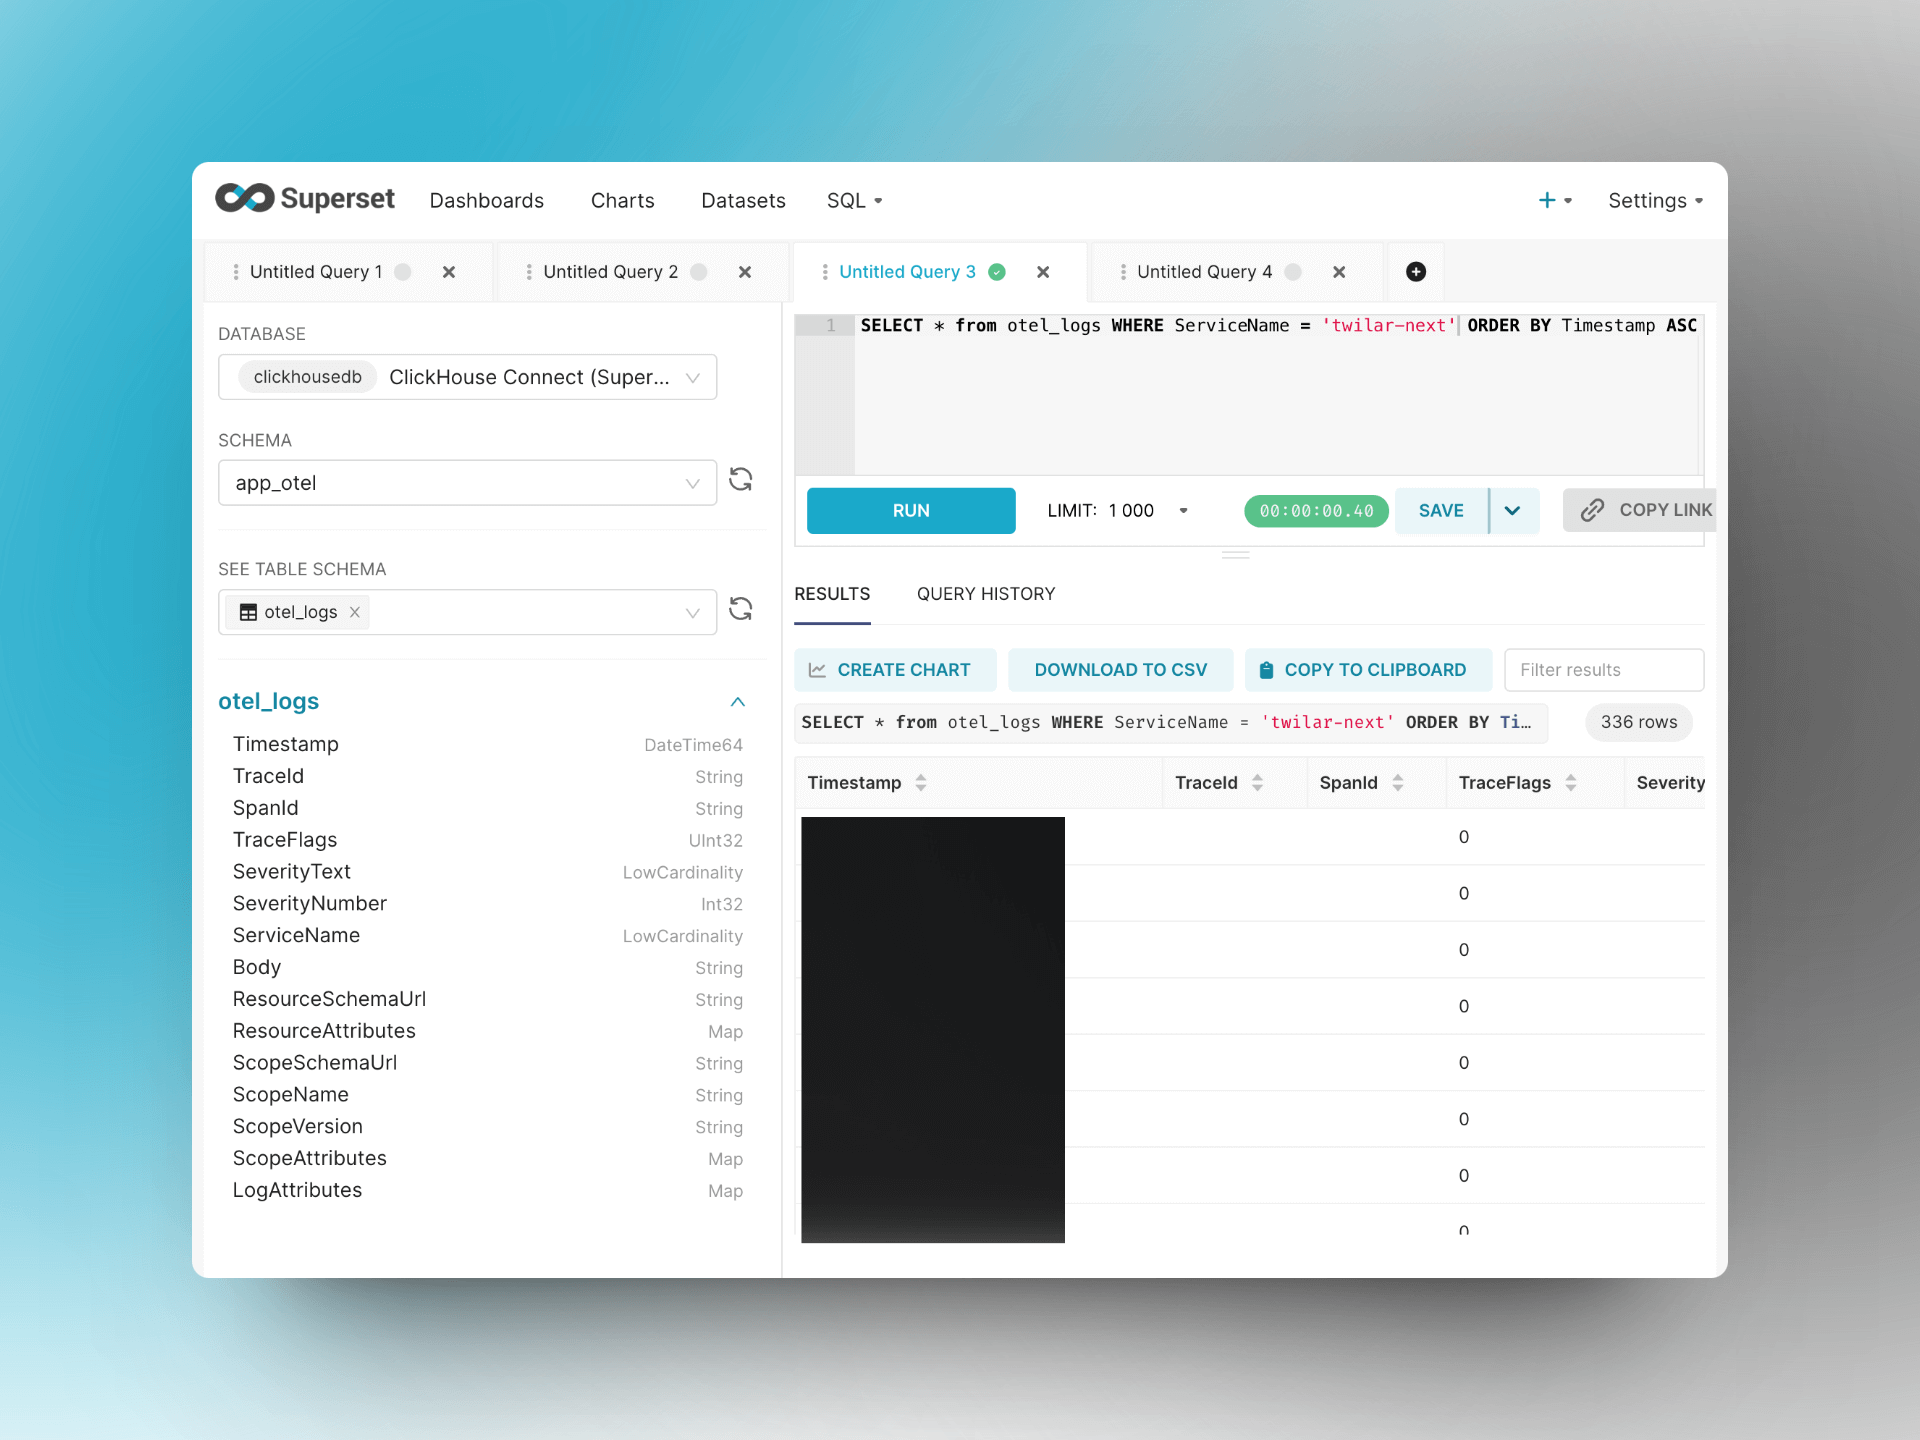
Second, to validate our client code works, we’d better use the SQL query to get some data. By default, there will be a table named otel_logs for all the Open Telemetry logs, uploaded by the sample code above, defaultOtelLogger.emit().
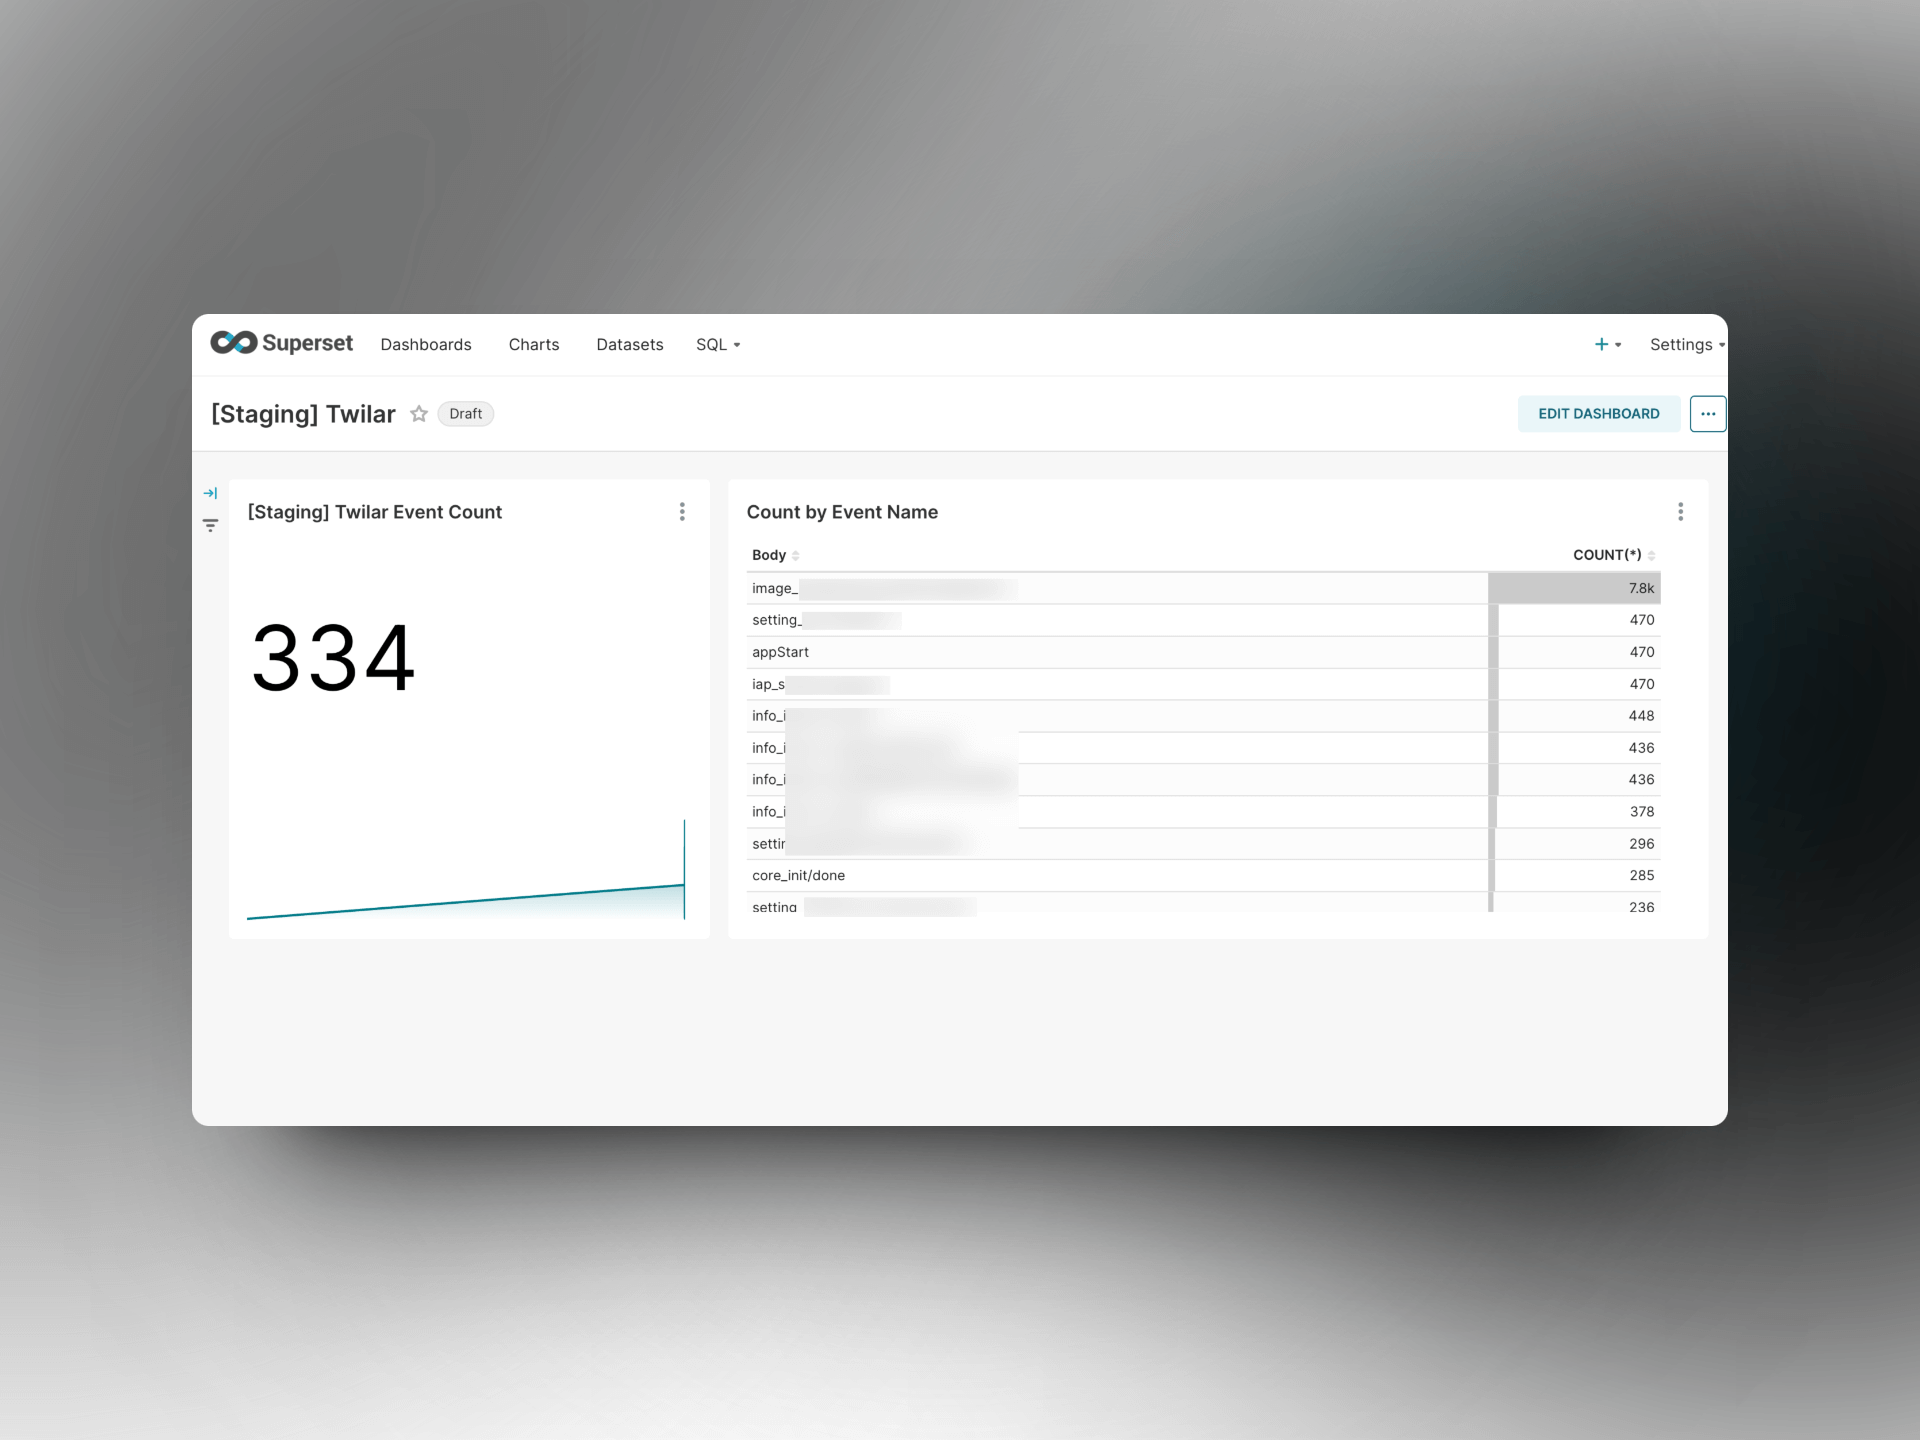
Then, you should be able to build some charts or dashboards, depends on your demands.
Summary
This blog post is definitely a code heavy but I do believe code can explains themselves, especially with my comments. If you found some parts are confusing or unclear, please comment below. I’ll try my best to improve it.
Thanks for your time of reading my blog!